Study on actual and self-reported measures of Facebook use
 Follow
A cross-post ∞. Thanks to prof. Rey Junco, a faculty associate at the Berkman Center for Internet and Society.
If you are a regular reader of this blog, you likely already know that there is a growing body of research that examines how college students use Facebook and the outcomes of such use. For instance, researchers have examined how Facebook use is related to various aspects of the college student experience including learning, student engagement, multitasking, political activity, life satisfaction, social trust, civic engagement, and political participation, development of identity and peer relationships, and relationship building and maintenance.
All of the previous research has relied on self-reported measures of Facebook use (that is, survey questions). We know from research in other areas of human behavior that there are significant differences between actual and self reported behaviors. One of my favorite examples is a study where researchers found that up to 50% of self-reported non-smoking head and neck cancer patients were indeed smoking as measured by exhaled carbon monoxide levels and levels of a nicotine metabolite in their blood.
As you might imagine, differences between self-reported and actual uses of Facebook could drastically change or even negate findings of how Facebook use is related to the aforementioned outcomes. My latest paper published in Computers in Human Behavior, Comparing actual and self-reported measures of Facebook use examines these differences.
Here is what I did: I paid students to allow me to install a monitor on their computers for one month. I also surveyed them to ask them how much time they spent on Facebook and how many times they logged in to the site. I also monitored/asked about other forms of tech/social media use (like Twitter and email).
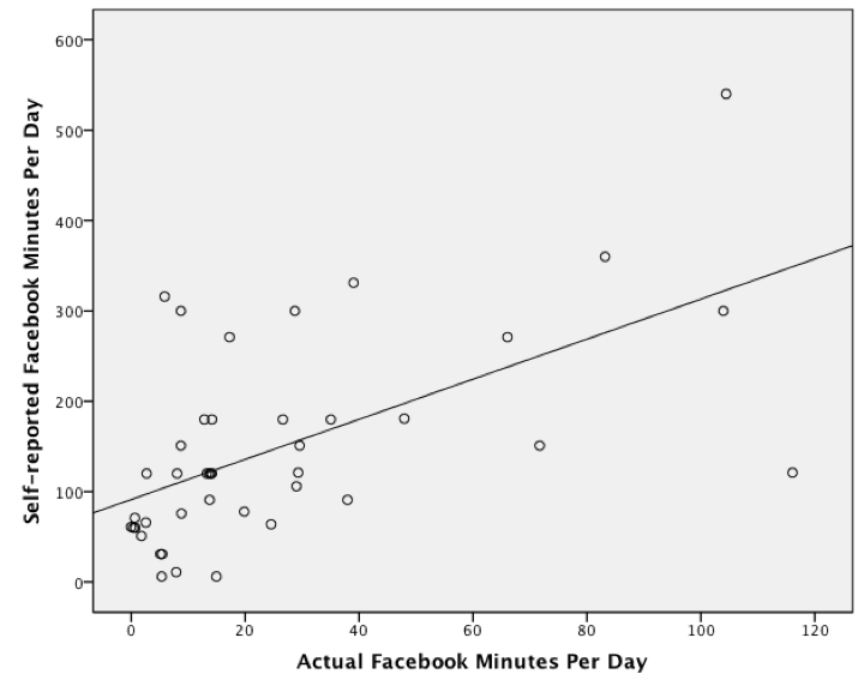
Here is what I found: As you can see in the scatterplot below, there was a significant positive correlation between self-reported and actual Facebook use (Pearson’s r = .587, p < .001).

However, and here is the really interesting part, students significantly overestimated the amount of time they spent on Facebook. They reported spending an average of 149 minutes per day on Facebook which was significantly higher than the 26 minutes per day they actually spent on the site (t(41) = 8.068, p < .001).
What is going on? In the paper, I go into much more detail about why there is such a large and significant difference between actual and self-reported Facebook use, as well as why the two are significantly correlated. In brief:
- It could be that self-report questions aren’t specific enough to capture frequency of Facebook usage. Students may interpret a question asking “how much time do you spend on Facebook each day?” as meaning “how much time are you logged in?” or as a post-hoc focus group suggested “how much time do you spend thinking about Facebook?”
- Students may have implicit theories about how they use technology that are likely based on messages received by the media and adults (i.e., “youth use Facebook a lot!”). This would lead them to give inflated estimates of the actual amount of time they spend on the site.
- Students may have accessed Facebook from multiple devices. This is certainly an important consideration, especially given the popularity of mobile Facebook use. However, I conducted analyses to try to explain the unaccounted-for self-reported time with mobile use and found that there was no way to explain the large difference between actual and self-reported time. Students could have used Facebook from other computers that were not being monitored; however, that is unlikely given their overall computer use. This is definitely an important facet to study in future research.
- Students (and people in general) might not be able to estimate Facebook use. This could very well be a function of how we’ve developed schemas about technology use. For instance, drivers often estimate driving distances in miles and time to destination; however, Internet users typically do not estimate frequency and intensity of use in time.
Limitations
Students who allowed their computer use to be monitored might have very different online behaviors than those who didn’t (although there were no differences between students who chose to install the monitoring software and those who didn’t on demographic variables and on all but one of the variables of interest). Another limitation is the possibility of observer effects or that the students behaved differently because they knew they were being monitored. Students may have used other devices, such as their cell phones, to access Facebook which would have provided a lower estimate of actual use.
Implications
It’s clear that self-reported measures of Facebook use canapproximate but are not accurate measures of actual use. The inconsistency between self-reported and actual measurements will obfuscate how Facebook use is related to outcomes, signaling a problem for research relying on self-report measures. However, all is not lost. Self-reported measures can give us a good approximation of frequency of use and hopefully, future extensions of this research can come up with more accurate self-report measures or with a “correction factor” for self-reported use.