The Carbon Footprint of Australian Migrations

 Follow
Measuring the impact of Australian migration on the Australian carbon footprint is a difficult task because of the complexity of the factors involved. However, a direct cause and effect relationship between the two exists, and it is related partially to population growth due to overseas migration, as well as to rural-urban migrations. Both of which are the consequence of the modernisation and urbanisation of Australian society. This article will present data and research findings about some of the factors that need to be taken into account when discussing the issue of the Australian greenhouse gas emissions. In conclusion it will also share some insights into some of the ways in which the Australian carbon footprint can be reduced.
Rural-Urban Migration
Australia is increasingly becoming an urbanised nation and the scope of migrations from rural to urban areas has recently been growing. A typically higher standard of living in urban areas, industrial development, the built environment and technological advancement; all have a considerable impact on the environment. With urbanisation, the consumption pattern in Australia is changing, and there is a significant increase in consumption per capita.
Recently, there has been more research on how population growth and internal migration into urban areas affect the environment. Australian households are directly responsible for about 20 percent of total carbon pollution. The increasing production of consumer goods has a major impact on the environment – there is an increase of carbon dioxide emissions, or greenhouse gas (GHG) emissions, which is considered the main cause of global warming. Consumption per capita is greater in urban than in rural areas. Greater volumes of transport and removals also have their share in the increase of the carbon footprint. The increase in waste streams resulting from greater consumption causes an amplification of emissions from landfill facilities, which currently emit about 15 million tonnes of carbon pollution per year.[1]
One of the ways to analyse household greenhouse gas expenditure is to break down how much energy consumption and greenhouse gas emissions a human being requires for different needs and aspects of living (such as food or mobility). According to Dr Manfred Lenzen, Professor of Sustainability Research at Integrated Sustainability Analysis (ISA) at the University of Sydney, the analysis of energy and greenhouse gas requirements of different stages in the economy is a better way to structure the data which needs to be considered when creating policies related to the reduction of the carbon footprint.[2]
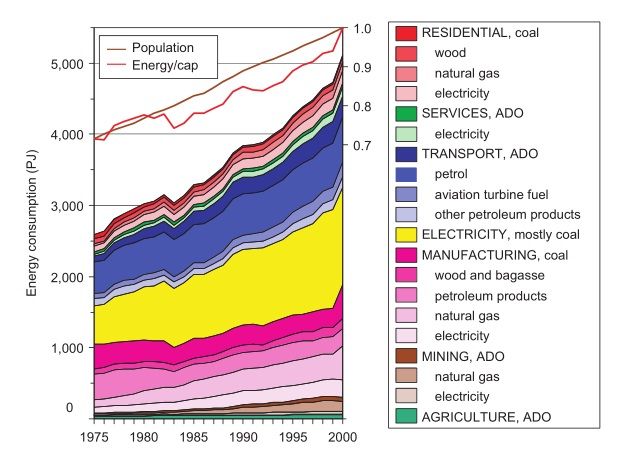
Resource Economics 2006)*
Professor Lenzen explained to us that the main advantage of the input-output method is that it includes a complete picture of a household’s GHG responsibility. In some information material from Professor Lenzen’s studies we see that the focus is on switching lights off, having shorter showers, or driving less. But what about our shopping habits? How much emissions were caused because of that T-shirt I just bought, or that flat-screen TV, or that surfboard, or that movie ticket, or that insurance policy? Such things are actually two thirds of the story and must not be ignored. Because if they were, policy would not be as effective as it could be. When it comes to the difference between the consumption-related carbon emissions of households in urban and in rural areas, people in the inner city drive less, so they have some advantages there. However people in rural households usually earn, and therefore spend less, which ultimately is a stronger effect, and therefore rural households cause (generally speaking) less GHG emissions.[3]
The increased need for residential space is another large contributor to carbon pollution through the construction industry and the disposal of demolition waste. Investments into energy efficient homes and appliances provide a partial solution to this problem. According to Professor Dr Deo Prasad, Director of the UNSW Centre for a Sustainable Built Environment, most of the potential low cost greenhouse gas emissions saving opportunities are known to be in the built environment – anywhere between 40-70%, depending on which report and boundary conditions they relate to. However, past experience suggests that market failure/barriers will prevent uptake of these opportunities, even with a price on carbon. In December last year Professor Prasad was one of the experts who launched the Low Carbon Living CRC, which brings together key property, planning, engineering and policy organisations with leading Australian researchers. Their focus was to develop new social, technological and policy tools for reducing greenhouse gas emissions in the built environment. The CRC will help unlock barriers to cost-effective carbon reduction opportunities, empower communities and facilitate the widespread adoption of integrated renewable energy. This will enable the sector to transition and contribute to Australia’s greenhouse gas emissions targets while maintaining industry competitiveness and improving quality of life.[4]
If we look at overall CO2 emissions of countries, according to the 2012 report on trends in global CO2 emissions by the PBL Netherlands Environmental Assessment Agency, Australia is the 16th biggest polluter in the world. However, if we look at CO2 emissions per capita, Australia has earned the unflattering title of the biggest polluter on the planet in 2009, when it replaced the U.S. in the first position with 18.3 tonnes of CO2 emissions per capita. In 2011, while the U.S. CO2 emission levels per capita decreased by 2 percent; Australia’s emissions rose by 3 percent.
Dr David Stern, Professor at the Australian National University and research associate at the Centre for Climate Economics and Policy, discusses his research findings; taking into account the differences between Australia and other countries in terms of the climate, and the type of industries we have – for example, we need less heating but the mining industry is very energy intensive – and other factors, Australia is relatively energy inefficient compared to other developed countries and progress on improving energy efficiency has been quite slow.[5]
There is probably a lot of scope for improving energy efficiency on the consumer side of the economy – energy efficiency of houses, water heating etc. The rebound effect where savings in energy costs are used to spend on other energy using goods and services is more limited for consumers than for industry, and so the gains could be substantial without a lot of take back. Of course, reduced energy use reduces carbon emissions. The Australian government’s carbon price will probably have some effect on this but better information, building codes etc. can help. We have the Energy Efficiency Rating (EER) system for houses for example, but do people know what it means?[6]
Professor Stern also points out that the biggest impact of immigration is going to be that immigrants are generally coming from countries with lower carbon emissions per capita than Australia. The fraction of immigrants coming from the US, Canada, Qatar etc. is small, though there are some. So, when immigrants move to Australia they will increase their emissions on average and that will increase global emissions.
Even though population growth is often quoted as one of the main reasons for the increase in Australia’s CO2 emissions, Australian society and economy are continually evolving and new technologies which contribute to sustainability are being developed on a constant basis. Therefore it is difficult if not impossible to calculate the optimal urban population growth of Australia. Greater sustainability can be achieved mainly through the regulation of urban development and consumption patterns in urban areas – these are the two factors that the government can easily influence both through direct and indirect measures. Urban planning additionally decreases the average commuting time, which is also a significant polluting factor.
Overseas Migration
More than one-fifth, i.e. 23 percent of Australians were born overseas. The majority of immigrants choose to settle in major cities – according to the 2006 Census, 82 percent of overseas-born Australian residents live in major urban areas. In comparison, only 61 percent of Australia-born citizens live in urban areas.[7] Since most migrants move into urban areas, they tend to adopt average urban Australian consumption patterns.
Net overseas migration (NOM) is the difference between the number of people leaving Australia and arriving to Australia in the long term. The influence of NOM on greenhouse gas emissions has been researched, and here are some projections of how NOM will influence air pollution in Australia in the future based on research conducted by the Australian Government Department of Immigration and Citizenship summarized in “Long-term physical implications of net overseas migration: Australia in 2050”:
“By mid -century, GHG emissions from fuel combustion were modelled to increase by about 60% above contemporary levels for a zero NOM level, and by 170%, and 200% for a NOM of 180,000 and 260,000 p.a.”[8]
While the aging of Australian population dictates immigration as the best solution for the future of Australian economic development; the Australian government is working on restructuring immigration policies, targets and quotas through the recently created Ministry of Sustainability, Environment, Water, Population and Communities in order to ensure sustainable population growth. The mutual influence of the environment, population growth and the economy on each other needs to be clearly established, and new solutions need to be found and implemented.
Until recently, there has been a lot of research on different aspects of immigration, but very little research related to where the immigrants settled within Australia and the impact of migrations into urban areas. Sydney is one of Australia’s cities with the most significant environmental strain, especially due to air pollution caused by increased migration. In the early two thousands there was a debate regarding claims blaming immigration for environmental issues in Sydney and other major cities. However, recently the emphasis has been put on the planning of urban development, the introduction of environmental restrictions and the implementation of environment-friendly technologies in many industries as the best solutions to this problem.
Additional Solutions
The principal solution to the increasing Australian carbon footprint which the Australian government started implementing last year is based on creating incentives that will drive the biggest Australian polluters to reduce their greenhouse gas emissions. On 1 July 2012 the Australian government started applying the equivalent carbon price, also known as the carbon tax, as part of the Australian Clean Energy Future Plan. Its goal is to build a clean energy future in Australia by reducing greenhouse gas emissions without hindering the economic growth. This measure will also allow for more investments in clean energy technologies – the Australian Government is currently investing around 5 billion dollars each year in green technologies.[9]
The carbon price will also help reduce the carbon footprint of the construction industry, as well as some other industries which have become major contributors to the Australian carbon footprint due to increasing migrations. The carbon price is aimed at companies which emit over 25,000 tonnes of CO2 equivalent per year, which are now required to pay a tax for every tonne of CO2 pollution they create. Public authorities and landfill operators are also responsible for emissions from landfills, and their inclusion in the carbon price is expected to result in the implementation of various measures aimed at reducing landfill waste emissions.
This type of government measure drives the big polluters to come up with more clean energy solutions, and to increase their energy efficiency in order to preserve their profit levels. Although this type of measure naturally raises the question of economic growth and competitiveness, the Australian Treasury projections show that there is no reason for concern – the Australian economy will continue to grow despite the introduction of the carbon price.[10] More and more businesses, from construction companies to removals companies, are taking measures to reduce their carbon footprint through reducing electricity consumption, using renewable sources of energy, purchasing carbon credits and implementing greener technologies. What are you doing to reduce your carbon footprint?
If you are interested in reducing your personal and your family’s carbon footprint, you can try the University of Sydney Australian Greenhouse Calculator, available at http://www.isa.org.usyd.edu.au/education/Online-Calculator.html.
If you would like to reduce the carbon footprint of your company, you can find the business carbon footprint calculator here:http://www.carbonneutral.com.au/carbon-calculator.html.
* Image taken from: Lenzen, M., Wood, R. and Foran, B. 2008. “Direct versus Embodied Energy – the Need for Urban Lifestyle Transitions”. In Dröge, P. Ed. 2008. Urban Energy Transition. Oxford and Amsterdam: Elsevier. 91-120.
References
1. “Emissions from Landfill Facilities”. Clean Energy Future. Available at http://www.cleanenergyfuture.gov.au/emissions-from-landfill-facilities-2/
2. Lenzen, M. (1998). “The energy and greenhouse gas cost of living for Australia during 1993-94”. Energy 23 (6). 497-516.
3. Lenzen, M., Dey, C., and Foran, B. (2004). “Energy Requirements of Sydney Households”. Ecological economics 49.
4. Low Carbon Living CRC website, http://www.lowcarbonlivingcrc.com.au/
5. Stern D. I., J. C. V. Pezzey, and N. R. Lambie (2012). “Where in the world is it cheapest to cut carbon emissions?”. Australian Journal of Agricultural and Resource Economics 56(3),.315-331. Available at http://www.sterndavidi.com/publications_type.html
6. Stern D. I. (2012). “Modeling international trends in energy efficiency”. Energy Economics 34. 2200-2208. Available at http://www.sterndavidi.com/publications_type.html
7. “Population Distribution Effects of Migration in Australia”. Australian Government, Department of Immigration and Citizenship. Available at http://www.immi.gov.au/media/publications/research/migration-in-australia/
8. Maude, A., Tan Y., Beer, A., Wei, Z. “Long-term physical implications of net overseas migration: Australia in 2050”. Australian Government, Department of Immigration and Citizenship. Available at http://www.immi.gov.au/media/publications/research/_pdf/physical-implications-migration-summary.pdf
9. “Reducing Australia’s Emissions”. Australian Government, Department of Climate Change and Energy Efficiency. Available at http://www.climatechange.gov.au/government/reduce.aspx
10. “Equivalent carbon price”. Available at http://www.environment.gov.au/cleanenergyfuture/carbon-price/index.html
11. Newman, P. “The Environmental Impact of Cities”. (2006). Environment and Urbanization 18. 275. Available at http://eau.sagepub.com/content/18/2/275.full.pdf+html
Author: Dunya Carter