Connectomics: a window to the mind
 Follow
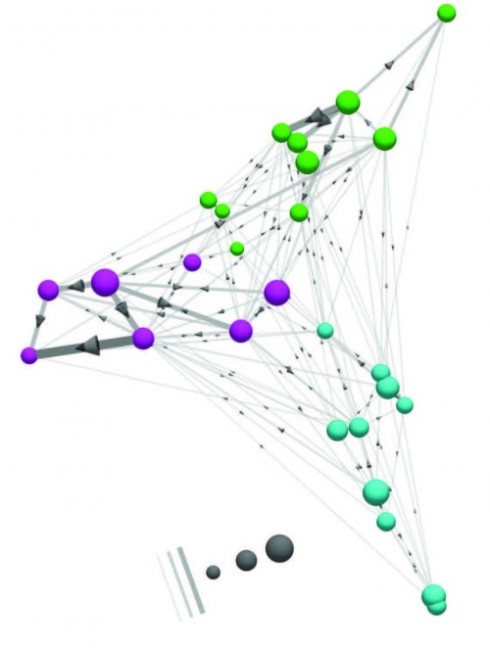
The human brain has 100 billion neurons, connected to each other in networks that allow us to interpret the world around us, plan for the future, and control our actions and movements. Mapping those networks, creating a wiring diagram of the brain could help scientists learn how we each become our unique selves. Understanding the brain and all its connections is Connectomics – a word soon to become as familiar as ‘genetics’.
In three papers appearing in Nature, scientists report their first step toward this goal: Firstly using a combination of human and artificial intelligence, they have mapped all the wiring among 950 neurons within a tiny patch of the mouse retina. While a second group look at a classic problem of neural computation – the detection of visual motion – in the eye of a fruitfly.
The eye of the mouse
The retina is technically part of the brain, as it is composed of neurons that process visual information. Neurons come in many types, and the retina is estimated to contain 50 to 100 types, but they’ve never been exhaustively characterised. Their connections are even less well known. Neurons in the retina are classified into five classes: photoreceptors, horizontal cells, bipolar cells, amacrine cells and ganglion cells. Within each class are many types, classified by shape and by the connections they make with other neurons.
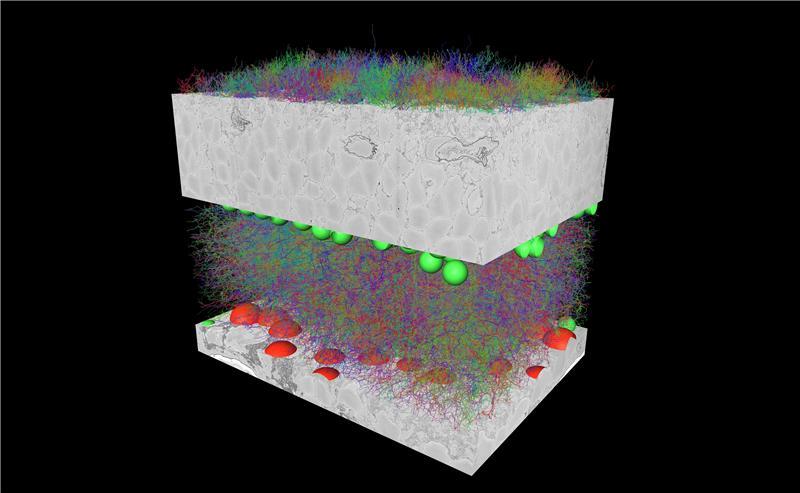
In this study, the research team focused on a section of the retina known as the inner plexiform layer, which is one of several layers sandwiched between the photoreceptors, which receive visual input, and the ganglion cells, which relay visual information to the brain via the optic nerve. The neurons of the inner plexiform layer help to process visual information as it passes from the surface of the eye to the optic nerve.
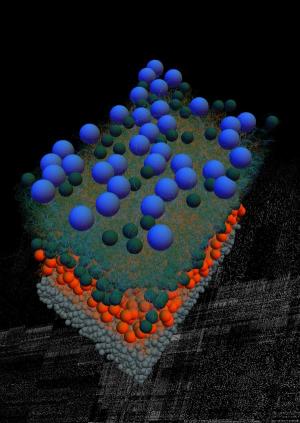
By mapping all of the neurons in a 117-micrometre-by-80-micrometre patch of tissue, researchers were able to classify most of the neurons they found, based on their patterns of wiring. They also identified a new type of retinal cell that had not been seen before. To map all of the connections in this small patch of retina, the researchers first took electron micrographs of the targeted section generating high-resolution three-dimensional images of biological samples.
Developing a wiring diagram from these images required both human and artificial intelligence. First, the researchers hired about 225 German undergraduates to trace the “skeleton” of each neuron, which took more than 20,000 hours of work (a little more than two years).
To flesh out the bodies of the neurons, the researchers fed these traced skeletons into a computer algorithm, which expands the skeletons into full neuron shapes. The researchers used machine learning to train the algorithm, known as a convolutional network, to detect the boundaries between neurons. Using those as reference points, the algorithm can fill in the entire body of each neuron.
The only previous complete wiring diagram, which mapped all of the connections between the 302 neurons found in the worm Caenorhabditis elegans, was reported in 1986 and required more than a dozen years of tedious labor.
Classifying neurons
Wiring diagrams allow scientists to see where neurons connect with each other to form synapses – the junctions that allow neurons to relay messages. By analyzing how neurons are connected to each other, researchers can classify different types of neurons.
The researchers were able to identify most of the 950 neurons included in the new retinal-wiring diagram based on their connections with other neurons, as well as the shape of the neuron. A handful of neurons could not be classified because there was only one of their type, or because only a fragment of the neuron was included in the imaged sample. In this study, the researchers identified a new class of bipolar cells, which relay information from photoreceptors to ganglion cells. However, further study is needed to determine this cell type’s exact function.
It should be noted, and is by the researchers, that this analysis provides contact information, but not synaptic strength. The absence of a contact always indicates a lack of synaptic connection. If our goal is to ‘learn how we each become our unique selves’ then synaptic strength is an important measure – an indication of cognitive abilities related to memory and learning.
The project of classifying types is not completed, but this work shows that it should be possible, in principle, if it’s scaled up to a larger piece of tissue. To analyse an entire mouse brain in this way would require several billion hours of human attention, that is 225 students for 200,000 years – suggesting that such a task is incredibly ambitious. The researchers are convinced, as are many other neurobiologists, that mapping and decoding the connectome will revolutionize brain research.
Ever tried to swat a fruit fly?
A fruitfly is effective at dodging predators and rapidly navigating during flight, so it is a perfect insect model for visual motion detection. It is easy to make simple models of motion detection: photoreceptor cells cannot detect direction but downstream (towards the brain) neurons, called tangential cells, do respond to the direction of movement. Somewhere in between lies the neural mechanism that creates this discrimination.
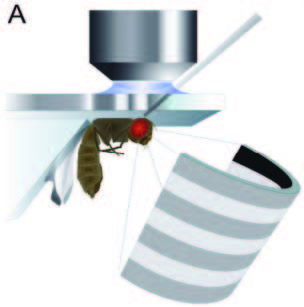
The authors here developed a semi-automatic method constructing a connectome of 379 neurons and 8,637 chemical synaptic contacts then matched these reconstructed neurons to cells types using light microscopy. Using this model and supportive evidence using some very elegant optical microscopy, which forms the third paper in Nature, the researchers identified the cells that constitute a motion detection circuit.
What these studies demonstrate is the power of connectomes to uncover key insights into the detail of the brain’s processing circuitry. At present the scales seem ‘mind-boggling’, any serious work would seem to be the province of well-heeled laboratories. However, as pointed out in a Nature News & Views article, “the researchers have stressed that the connectomic reconstructions will be public resources” making these invaluable resources for neuroscience.
Connectomics – a word to be remembered.
Orrman-Rossiter K (2013-08-26 00:08:44). Connectomics: a window to the mind. Australian Science. Retrieved: Jun 23, 2026, from https://ozscience.com/science-2/connectomics-a-window-to-the-mind/
1 thought on “Connectomics: a window to the mind”
Comments are closed.