The Mathematics of War

Scientists often exercise a certain detachment when doing their work. I’ve often seem friends and colleagues get “lost in the numbers” and forget precisely what it is they’re looking at and what those numbers actually mean. However, in some cases this may not be a bad thing. For instance, in the analysis of conflict data.
Putting aside any personal reactions and moral implications of what you’re really looking at may not be easy for everyone, but analysis of conflict data is important in predicting the behaviour of wars and potentially minimising risks and harm in the future. Technology is marching on, and as a result the amount of data being collected from war zones is huge. With the state of social media, internet resources like Twitter and Facebook have proven to be valuable sources of information, providing a quick way to share information with people trapped in the middle of troubled areas – a remarkably significant use which I’m sure no one could have ever predicted when these services originally started up. The problem for researchers lies in how exactly to use that data. Constructing a model of how a conflict will unfold and making predictions from it may be vital in stopping things from escalating out of control. Unfortunately, such predictions aren’t easily made.
The idea that the movements of masses of people could be predicted is not a new one. In fact, in his typically insightful manner, the idea was first devised by Isaac Asimov who created the fictional science of psychohistory, featured in his 1951 novel Foundation. Asimov’s ideas weren’t without firm basis in reality, and while the details may be different, it seems like the concept of psychohistory may not be quite so fictional after all.
Predicting the Afghan War Diaries

Between then, a group of researchers based in Edinburgh and Sheffield in the UK and New York decided to try a different approach. They noted that most of the data analysed previously didn’t go beyond simply visualising what had been seen and recorded. Actual predictions had proved too challenging, not least because it hadn’t been clear how to actually model the data available.
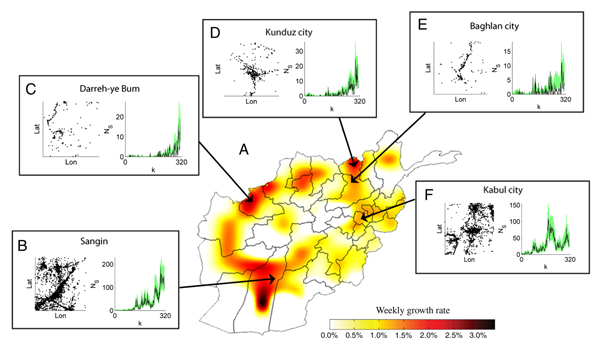
This group of researchers, led by Guido Sanguinetti, constructed a set of methods to use statistical dynamic modelling to make predictions on conflicts such as the recent war in Afghanistan. They needed to look at the times and locations, as well as how information was transported from place to place. They decided that the best way to analyse how a conflict unfolded was to treat it the way other researchers model environmental events and the spread of infectious diseases. In many ways, these events proceed in ways very similar to outbreaks of violence during conflicts.
In this case though, Sanguinetti and his colleagues had an ace up their sleeve. Courtesy of the now infamous whistleblowers at WikiLeaks, a huge disclosure of US military logs from the Afghan conflict had been made in 2010. Known as the Afghan War Diary, this set of records drew a lot of attention internationally on its release and also served to be the ideal way of testing the effectiveness of any predictions. Essentially, Sanguinetti and the others could use their models to make predictions on the conflict and then check against the released reports to see how accurate they’d been.
Conflict climates
Remarkably, based entirely on written reports between 2004 and 2009, they were able to predict with impressive accuracy, what events would occur in 2010. In short, using nothing but some clever mathematics, the researchers could tell what would likely happen next. Where conflicts would increase in intensity and where things would remain quiet. And this isn’t even a comprehensive model yet. There are many adjustments which can still be made to improve the accuracy still further. Even accounting for sudden changes, like the dramatic increase of US forces in Afghanistan in 2010, the predictions remained accurate. Evidently, events will continue unabated despite any large military offensives which may be taking place.
The war in Afghanistan has not been of the traditional type between two armies. Instead, the conflict there has been irregular, involving a huge number of loosely connected groups. This may be the reason why a relatively simple model works so well in predicting the behaviour of those groups – where and when violence would escalate. This sort of behaviour is typically the sort that large scale armies have trouble in countering due to the lack of any centralised organisation. Mathematically speaking, it genuinely becomes a lot like trying to predict the weather.
To me, this kind of work offers some hope in resolving serious conflicts as quickly as possible. Being a pacifist myself, I abhor violence of any kind, and the ability to predict and avoid any serious bloodshed is certainly a good thing. Whatever your feelings on it, the ability to predict violence in conflict situations the same way meteorologists predict the weather has some potentially very useful possibilities.

Hammonds M (2012-08-30 00:35:04). The Mathematics of War. Australian Science. Retrieved: Jan 18, 2026, from https://ozscience.com/news/the-mathematics-of-war/
 Follow
Thanks for the writeup! I had heard a bit about this research but haven’t yet taken the time to look at it myself. It’s good to know that they actually split the data into a training & test set. How precise were the predictions for 2010? Was it something as vague as “violence in province X will increase/decrease” (which is the sort of thing one could already get from, eg, an officer’s intuition) or were the predictions more quantitative & precise?